Multiple Choice
Figure 30-1 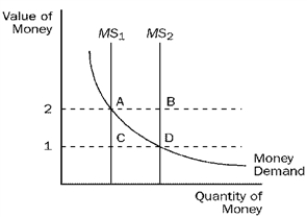
-Refer to Figure 30-1.When the money supply curve shifts from MS1 to MS2,
A) the demand for goods and services decreases.
B) the economy's ability to produce goods and services increases.
C) the equilibrium price level decreases.
D) None of the above is correct.
Correct Answer:

Verified
Correct Answer:
Verified
Related Questions
Q26: Suppose that monetary neutrality and the Fisher
Q27: Figure 30-2.On the graph,MS represents the money
Q29: An assistant manager at a restaurant gets
Q31: If M = 6,000,P = 3,and Y
Q32: When the money market is drawn with
Q33: In 2010 the U.S.government was running a
Q35: If V and M are constant and
Q76: Most economists believe the principle of monetary
Q79: Under the assumptions of the Fisher effect
Q115: If Y and V are constant and