Multiple Choice
Figure 30-2.On the graph,MS represents the money supply and MD represents money demand.The usual quantities are measured along the axes. 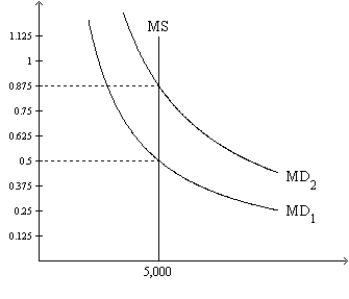
-Refer to Figure 30-2.If the relevant money-demand curve is the one labeled MD1,then
A) when the money market is in equilibrium,one dollar purchases one-half of a basket of goods and services.
B) when the money market is in equilibrium,one unit of goods and services sells for 2 dollars.
C) there is an excess demand for money if the value of money in terms of goods and services is 0.375.
D) All of the above are correct.
Correct Answer:

Verified
Correct Answer:
Verified
Q22: The nominal interest rate is 6 percent
Q23: According to the classical dichotomy,which of the
Q24: Figure 30-1 <img src="https://d2lvgg3v3hfg70.cloudfront.net/TB2297/.jpg" alt="Figure 30-1
Q26: Suppose that monetary neutrality and the Fisher
Q29: An assistant manager at a restaurant gets
Q30: Figure 30-1 <img src="https://d2lvgg3v3hfg70.cloudfront.net/TB2297/.jpg" alt="Figure 30-1
Q31: If M = 6,000,P = 3,and Y
Q32: When the money market is drawn with
Q79: Under the assumptions of the Fisher effect
Q115: If Y and V are constant and