Multiple Choice
Figure 30-2.On the graph,MS represents the money supply and MD represents money demand.The usual quantities are measured along the axes. 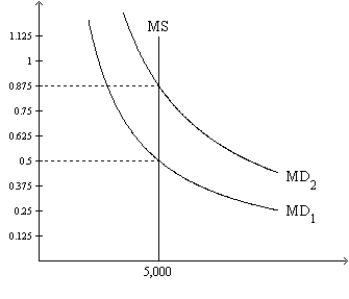
-Refer to Figure 30-2.What quantity is measured along the horizontal axis?
A) the price level
B) the real interest rate
C) the value of money
D) the quantity of money
Correct Answer:

Verified
Correct Answer:
Verified
Q8: When the money market is drawn with
Q9: When money is neutral,which of the following
Q10: According to the classical dichotomy,which of the
Q11: The price level rises if either<br>A)money demand
Q12: Suppose that monetary neutrality and the Fisher
Q14: Figure 30-3.On the graph,MS represents the money
Q15: When the money market is drawn with
Q16: When the money market is drawn with
Q17: If Y and M are constant and
Q18: Evidence concerning hyperinflation indicates a clear link