Multiple Choice
Figure 30-3.On the graph,MS represents the money supply and MD represents money demand.The usual quantities are measured along the axes. 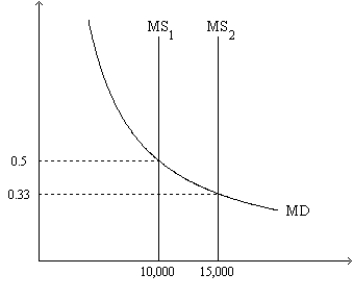
-Refer to Figure 30-3.Suppose the relevant money-supply curve is the one labeled MS1;also suppose the economy's real GDP is 30,000 for the year.If the money market is in equilibrium,then the velocity of money is approximately
A) 3.0
B) 6.0
C) 9.0
D) 1.5
Correct Answer:

Verified
Correct Answer:
Verified
Q9: When money is neutral,which of the following
Q10: According to the classical dichotomy,which of the
Q11: The price level rises if either<br>A)money demand
Q12: Suppose that monetary neutrality and the Fisher
Q13: Figure 30-2.On the graph,MS represents the money
Q15: When the money market is drawn with
Q16: When the money market is drawn with
Q17: If Y and M are constant and
Q18: Evidence concerning hyperinflation indicates a clear link
Q19: Figure 30-2.On the graph,MS represents the money