Multiple Choice
Figure 30-3.On the graph,MS represents the money supply and MD represents money demand.The usual quantities are measured along the axes. 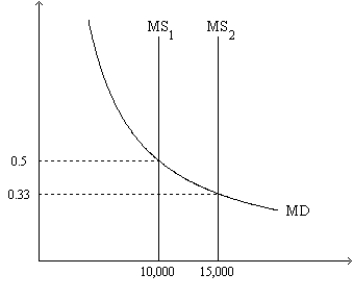
-Refer to Figure 30-3.If the relevant money-supply curve is the one labeled MS1,then the equilibrium price level is
A) 0.5 and the equilibrium value of money is 2.
B) 2 and the equilibrium value of money is 0.5.
C) 0.5 and the equilibrium value of money cannot be determined from the graph.
D) 2 and the equilibrium value of money cannot be determined from the graph.
Correct Answer:

Verified
Correct Answer:
Verified
Q109: To explain the long-run determinants of the
Q235: Based on the quantity equation,if M =
Q236: The Fisher effect says that<br>A)the nominal interest
Q237: Over time both real GDP and the
Q238: As the price level decreases,the value of
Q240: Which of the following is not implied
Q241: Based on past experience,if a country is
Q242: In which case below is the real
Q243: When the money market is drawn with
Q244: When the money market is drawn with