Multiple Choice
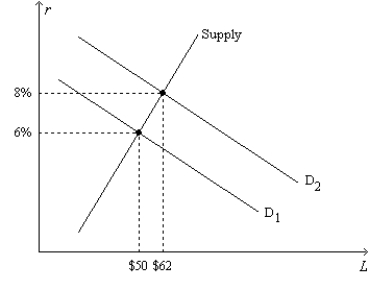
Figure 26-4.On the horizontal axis of the graph,L represents the quantity of loanable funds in billions of dollars. 
-Refer to Figure 26-4.Which of the following events could explain a shift of the demand-for-loanable-funds curve from
D1 to D2 ?
A) The tax code is reformed to encourage greater saving.
B) The tax code is reformed to encourage greater investment.
C) The government starts running a budget deficit.
D) The government starts running a budget surplus.
Correct Answer:

Verified
Correct Answer:
Verified
Q92: What is the main function of the
Q101: The source of the supply of loanable
Q191: If the quantity of loanable funds demanded
Q192: Figure 26-4.On the horizontal axis of the
Q193: If the quantity of loanable funds demanded
Q194: Other things the same,an increase in the
Q195: Which of the following events could explain
Q196: Other things the same,if the government increases
Q199: Other things the same,the effects of an
Q200: When the government goes from running a