Multiple Choice
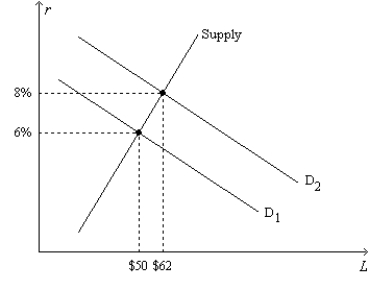
Figure 26-4.On the horizontal axis of the graph,L represents the quantity of loanable funds in billions of dollars. 
-Refer to Figure 26-4.If the equilibrium quantity of loanable funds is $56 billion and if the rate of inflation is 4 percent,then the equilibrium real interest rate is
A) lower than 6 percent.
B) 6 percent.
C) between 6 percent and 8 percent.
D) higher than 8 percent.
Correct Answer:

Verified
Correct Answer:
Verified
Q120: Bond A and Bond B have identical
Q187: Figure 26-2.The figure depicts a supply-of-loanable-funds curve
Q188: Figure 26-5.Figure 26-5 shows the loanable funds
Q189: Other things the same,if the government decreases
Q191: If the quantity of loanable funds demanded
Q193: If the quantity of loanable funds demanded
Q194: Other things the same,an increase in the
Q195: Which of the following events could explain
Q196: Other things the same,if the government increases
Q197: Figure 26-4.On the horizontal axis of the