Multiple Choice
Figure 2-16 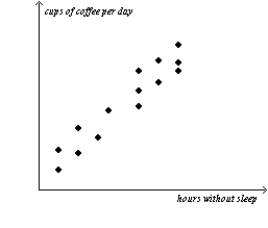
-Refer to Figure 2-16.The graph shown is known as a
A) time-series graph.
B) bar graph.
C) scatterplot.
D) pie chart.
Correct Answer:

Verified
Correct Answer:
Verified
Related Questions
Q32: Figure 2-16 <img src="https://d2lvgg3v3hfg70.cloudfront.net/TB2297/.jpg" alt="Figure 2-16
Q33: In the ordered pair (20,30),20 is the<br>A)the
Q34: Figure 2-20<br>Relationship Between Years of Education and
Q35: Figure 2-18<br>Relationship between Price and Restaurant Meals
Q37: The argument that purchases of minivans cause
Q38: An ordered pair is<br>A)the process of checking
Q39: A demand curve displaying the relationship between
Q40: Alfonso has noticed that increases in unemployment
Q41: Which of the following is not correct?<br>A)The
Q163: When a relevant variable that is not