Multiple Choice
Figure 2-20
Relationship Between Years of Education and Annual Income 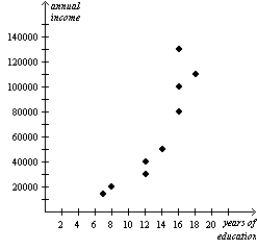
-Refer to Figure 2-20.Senator Smith observes the graph and concludes that people who earn higher incomes attend school for more years.Senator Jones observes the graph and concludes that people who attend school for more years earn higher incomes.Who is correct?
A) Senator Smith is correct.
B) Senator Jones is correct.
C) It is difficult to say which senator might be correct due to the reverse causality problem.
D) It is difficult to say which senator might be correct due to omitted variable bias.
Correct Answer:

Verified
Correct Answer:
Verified
Q29: Which of the following allows you to
Q30: Which of the following is not correct?<br>A)When
Q32: Figure 2-16 <img src="https://d2lvgg3v3hfg70.cloudfront.net/TB2297/.jpg" alt="Figure 2-16
Q33: In the ordered pair (20,30),20 is the<br>A)the
Q35: Figure 2-18<br>Relationship between Price and Restaurant Meals
Q36: Figure 2-16 <img src="https://d2lvgg3v3hfg70.cloudfront.net/TB2297/.jpg" alt="Figure 2-16
Q37: The argument that purchases of minivans cause
Q38: An ordered pair is<br>A)the process of checking
Q39: A demand curve displaying the relationship between
Q163: When a relevant variable that is not