Multiple Choice
Figure 2-18
Relationship between Price and Restaurant Meals 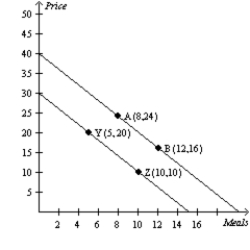
-Refer to Figure 2-18.The slope of the line containing points Y and Z is
A) -0.5.
B) -1.
C) -2.
D) -4.
Correct Answer:

Verified
Correct Answer:
Verified
Related Questions
Q38: An ordered pair is<br>A)the process of checking
Q39: A demand curve displaying the relationship between
Q40: Alfonso has noticed that increases in unemployment
Q41: Which of the following is not correct?<br>A)The
Q44: When two variables have a positive correlation,<br>A)when
Q45: The second number in any ordered pair
Q46: Figure 2-18<br>Relationship between Price and Restaurant Meals
Q47: The y-coordinate is the<br>A)first number of an
Q48: A demand curve shows the relationship<br>A)between income
Q93: The point where both x and y