Multiple Choice
Figure 2-18
Relationship between Price and Restaurant Meals 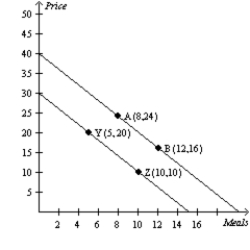
-Refer to Figure 2-18.A movement from point A to point B is called
A) a shift in demand.
B) a movement along the demand curve.
C) a shift in supply.
D) a movement along the supply curve.
Correct Answer:

Verified
Correct Answer:
Verified
Q41: Which of the following is not correct?<br>A)The
Q43: Figure 2-18<br>Relationship between Price and Restaurant Meals
Q44: When two variables have a positive correlation,<br>A)when
Q45: The second number in any ordered pair
Q47: The y-coordinate is the<br>A)first number of an
Q48: A demand curve shows the relationship<br>A)between income
Q49: The y-coordinate of an ordered pair specifies
Q50: The use of the coordinate system allows<br>A)for
Q51: A relatively steep demand curve indicates that<br>A)quantity
Q93: The point where both x and y