Multiple Choice
Figure 2-19
In the following graph the x-axis shows the number of times a commuter rail train stops at a station per hour and the y-axis shows the number of commuter rail passengers per hour.
Commuter Rail Passengers by Frequency of Service 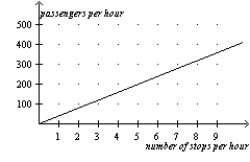
-Refer to Figure 2-19.Which of the following conclusions should not be drawn from observing this graph?
A) There is a positive correlation between the frequency of service and the number of passengers.
B) When there are 5 stops per hour,there are approximately 200 passengers.
C) More stops per hour is associated with more passengers per hour.
D) No other factors besides the frequency of service affect the number of passengers.
Correct Answer:

Verified
Correct Answer:
Verified
Q10: Suppose price is measured along the vertical
Q11: Figure 2-17 <img src="https://d2lvgg3v3hfg70.cloudfront.net/TB2297/.jpg" alt="Figure 2-17
Q13: When two variables have a negative correlation,<br>A)when
Q14: Suppose that someone makes the argument that
Q16: If Martina's income increases and,as a result,she
Q17: Figure 2-20<br>Relationship Between Years of Education and
Q18: The slope of a fairly flat upward-sloping
Q19: Graphs such as bar graphs and pie
Q20: The slope of a line passing through
Q226: The x-coordinate of an ordered pair specifies