Multiple Choice
Figure 2-17 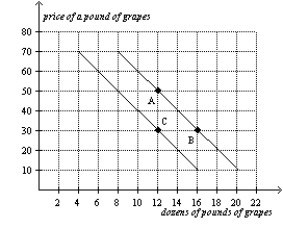
-Refer to Figure 2-17.The movement from point A to point B is a(n)
A) shift of the demand curve.
B) indication of a change in preferences for grapes.
C) movement along the demand curve.
D) indication of an increase in income.
Correct Answer:

Verified
Correct Answer:
Verified
Q6: In the ordered pair (5,3),3 is the<br>A)horizontal
Q7: Eva wants to create a graph containing
Q8: Figure 2-17 <img src="https://d2lvgg3v3hfg70.cloudfront.net/TB2297/.jpg" alt="Figure 2-17
Q9: Figure 2-17 <img src="https://d2lvgg3v3hfg70.cloudfront.net/TB2297/.jpg" alt="Figure 2-17
Q10: Suppose price is measured along the vertical
Q13: When two variables have a negative correlation,<br>A)when
Q14: Suppose that someone makes the argument that
Q15: Figure 2-19<br>In the following graph the x-axis
Q16: If Martina's income increases and,as a result,she
Q226: The x-coordinate of an ordered pair specifies