Multiple Choice
A random sample of patients who attended a clinic was selected. The age of the patient (years) and the number of days since the last visit were collected and are displayed in the figure below. The least-squares regression line for predicting number of days since the last visit from the age of the patient is y = 600.081 - 8.694x. 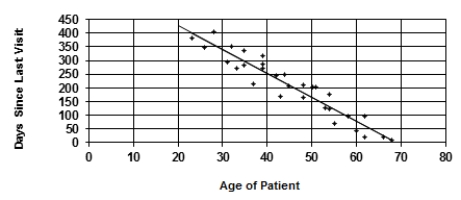 The slope of this line tells us the
A) correlation between age of patient and days since last visit.
B) change in days since last visit for each year older a patient is, on average.
C) change in the age of the patient for each extra day since the last visit.
D) average days since last visit for all of the patients.
Correct Answer:

Verified
Correct Answer:
Verified
Q24: A study of many countries finds a
Q25: A education researcher measured the IQ test
Q26: A year-long fitness center study sought to
Q27: Perfect correlation means all of the following
Q28: Consider a large number of countries around
Q30: What can we say about the relationship
Q31: A study of 6,600 men found that
Q32: Deaths from highway accidents went down after
Q33: The best way to settle questions of
Q34: Lean body mass (your weight leaving out