Multiple Choice
A education researcher measured the IQ test scores of 78 seventh-grade students in a rural school, and also their school grade point average (GPA) measured on a 12-point scale. Here is a graph of GPA versus IQ for these students: 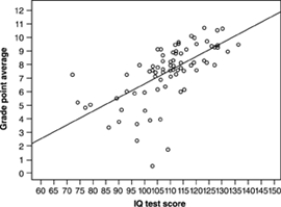 The line drawn on the graph is the least-squares regression line of GPA on IQ. Use this line to predict the GPA of a student with IQ 110. Your prediction is GPA about
A) 1.7.
B) 6)
C) 7.5.
D) 9.
Correct Answer:

Verified
Correct Answer:
Verified
Q20: A year-long fitness center study sought to
Q21: A year-long fitness center study sought to
Q22: A random sample of patients who attended
Q23: Lean body mass (your weight leaving out
Q24: A study of many countries finds a
Q26: A year-long fitness center study sought to
Q27: Perfect correlation means all of the following
Q28: Consider a large number of countries around
Q29: A random sample of patients who attended
Q30: What can we say about the relationship