Multiple Choice
Here is a table of the undergraduate enrollment at a large state university, broken down by class: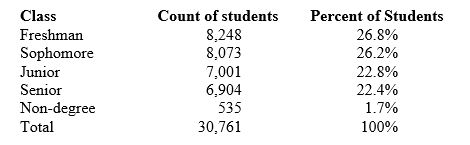
To make a correct graph of the distribution of students by class, you could use a
A) bar graph.
B) pie chart.
C) line graph.
D) Answers bar graph, pie chart, and line graph are correct.
E) Both bar graph and pie chart are correct.
Correct Answer:

Verified
Correct Answer:
Verified
Q20: In order to create a good graph,
Q21: To illustrate a talk you are giving,
Q22: Does using a cell phone while driving
Q23: Using data on the average national cost
Q24: The proper graph for showing the percentage
Q25: Is the level of belief in anthropogenic
Q26: If a bar graph is to be
Q27: A bar graph compares the size of
Q28: When a line graph displays data after
Q29: In a young woman's study group, 7