Multiple Choice
Use the following to answer questions: 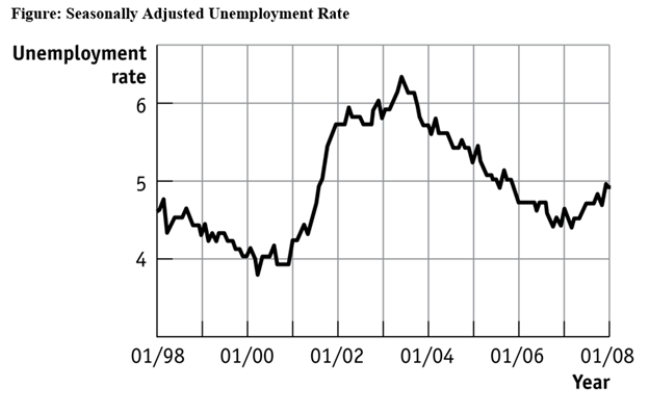
-(Figure: Seasonally Adjusted Unemployment Rate) Use Figure: Seasonally Adjusted Unemployment Rate.The distance between each labeled point on the horizontal axis is 1 year,and the distance between each labeled point on the vertical axis is 1 percentage point of unemployment.What is the approximate slope of the graph between 1/2004 and 1/2006 (using percentage point and years as the units on the vertical and horizontal axes,respectively) ?
A) 1/2
B) 1
C) -1/2
D) -2
Correct Answer:

Verified
Correct Answer:
Verified
Q1: On a two-dimensional graph representing two variables:<br>A)a
Q12: Use the following to answer question: <img
Q14: Use the following to answer question: <img
Q23: Use the following to answer question: <img
Q27: Use the following to answer question: <img
Q39: A linear curve has the same slope
Q44: A positive relationship between swimsuits purchased and
Q45: Use the following to answer question: <img
Q49: Use the following to answer question: <img
Q56: Taylor sees a bar graph showing the