Here Are Plots for Studentized Residuals Against Chest Compare the Regression with the Previous One
Essay
Here are plots for Studentized residuals against Chest. 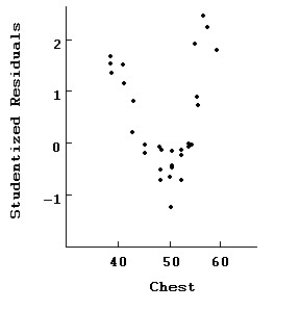 Here is the same regression with the two data points with residuals above 2 removed:
Dependent variable is: Weight
30 total bears of which 2 are missing
R-squared = 93.8% R-squared (adjusted)= 93.0%
s = 7.22 with 28 - 4 = 24 degrees of freedom Compare the regression with the previous one.In particular,which model is likely to make the best prediction of weight? Which seems to fit the data better?
Correct Answer:

Verified
Omitting the two values significantly ch...View Answer
Unlock this answer now
Get Access to more Verified Answers free of charge
Correct Answer:
Verified
View Answer
Unlock this answer now
Get Access to more Verified Answers free of charge
Q1: How would you interpret the coefficient of
Q2: Here are plots of data for Studentized
Q3: An actuary wishes to predict the life
Q4: How would you interpret the coefficient of
Q6: Here are plots of data for Studentized
Q7: The manager of a human resources
Q8: Here are plots of data for
Q9: Here is the scatterplot of externally Studentized
Q10: A real estate agent wishes to predict
Q11: The manager of a human resources