Multiple Choice
The scatterplot below displays the average longevity (in years) plotted against gestation (in days) for a number of different mammals.For what range of gestation lengths is a linear model appropriate? 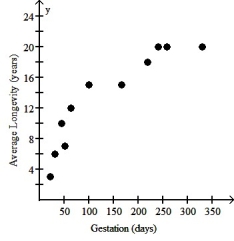
A) A linear model should not be used for any part of the data.
B) One linear model is appropriate for 0 through 200 days and another linear model for 200 through 350 days.
C) A single linear model is appropriate for the entire data set.
D) One linear model is appropriate for 0 through 100 days and another linear model for 150 through 350 days.
E) A linear model should be used for each pair of adjacent data points.
Correct Answer:

Verified
Correct Answer:
Verified
Q12: Which of the following scatterplots of residuals
Q13: The scatterplot below shows the percentage of
Q14: An economist noticed that nations with more
Q15: Which of the labeled points below are
Q16: The scatterplot below displays world population (in
Q18: Which of the following scatterplots of residuals
Q19: The figure below shows the association between
Q20: The scatterplot below displays the total home
Q21: Which of the labeled points below are
Q22: The figure below shows the association between