Multiple Choice
The figure below shows the association between life expectancy and infant mortality for several different countries.Also shown is the equation and correlation from a regression analysis.What is the correct conclusion to draw from the figure? 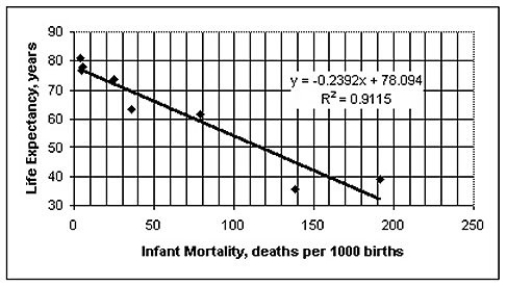
A) Countries that have low life expectancies and high infant mortality rates seem to have less regard for the sanctity of human life.
B) While there appears to be a very strong association,there is probably not a cause-and-effect relationship between infant mortality and life expectancy.Access to basic health care is probably a lurking variable that drives both life expectancy and infant mortality.
C) Those countries with low life expectancies clearly have no regard for children or expectant mothers.
D) The association must be coincidental.I would expect the association to have a positive slope,not the negative one illustrated above.
E) High infant mortality is causing reduced life expectancy,probably because of the increased emotional stress exerted on parents who have lost a child at birth.
Correct Answer:

Verified
Correct Answer:
Verified
Q17: The scatterplot below displays the average longevity
Q18: Which of the following scatterplots of residuals
Q19: The figure below shows the association between
Q20: The scatterplot below displays the total home
Q21: Which of the labeled points below are
Q23: The figure below examines the association between
Q24: The table below displays the latitude
Q25: Which of the following scatterplots of residuals
Q26: Which of the labeled points below will
Q27: A university studied students' grades and established