Multiple Choice
The table below shows the age and annual income of 12 randomly selected college graduates all living in the same city. Age Annual Income (dollars)
26 28,520
31 36,750
55 72,155
47 43,225
38 34,197
50 60,030
29 31,625
33 55,975
40 37,064
52 75,082
25 19,055
The scatter plot and regression equation are shown below: 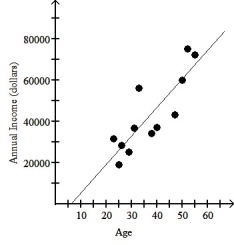 The regression analysis of this data yields the following values: R2 = 0.7182
Use this model to predict the annual income of a 56 year old college graduate living in this city.
A) $77,333
B) $61,367
C) $85,780
D) $70,230
E) $68,886
Correct Answer:

Verified
Correct Answer:
Verified
Q6: The scatterplot below displays the yearly production
Q7: Which of the labeled points below are
Q8: The data in the table below
Q9: A study finds a strong positive association
Q10: The figure below shows the recent
Q12: Which of the following scatterplots of residuals
Q13: The scatterplot below shows the percentage of
Q14: An economist noticed that nations with more
Q15: Which of the labeled points below are
Q16: The scatterplot below displays world population (in