Multiple Choice
The figure below shows the recent trend in first-birth rate for women in the U.S.A.between the ages of 18 and 19.(The first-birth rate is the number of 18 to 19 year-olds per 1000 who give birth to their first child) . 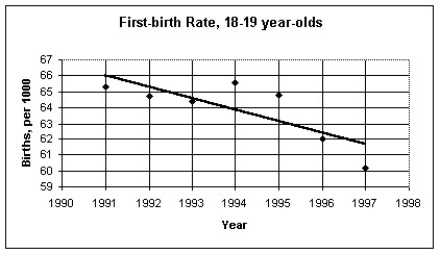 The regression analysis of this data yields the following values: R2 = 0.6174 Use this model to predict the first-birth rate for 18 to 19 year-olds in 2006.
A) 58 per 1000
B) 55 per 1000
C) 51 per 1000
D) 61 per 1000
E) 53 per 1000
Correct Answer:

Verified
Correct Answer:
Verified
Q5: A college admissions officer in the U.S.A.,defending
Q6: The scatterplot below displays the yearly production
Q7: Which of the labeled points below are
Q8: The data in the table below
Q9: A study finds a strong positive association
Q11: The table below shows the age
Q12: Which of the following scatterplots of residuals
Q13: The scatterplot below shows the percentage of
Q14: An economist noticed that nations with more
Q15: Which of the labeled points below are