Multiple Choice
The figure below examines the association between life expectancy and computer ownership for several countries.Also shown are the equation and R2 value from a linear regression analysis.What is the best conclusion to draw from the figure? 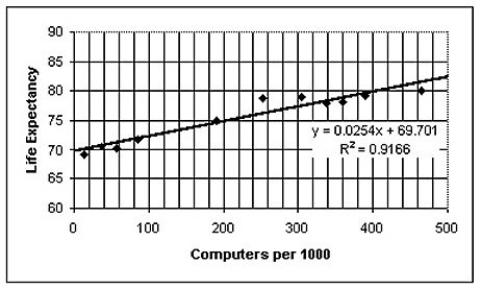
A) Exposure to the radiation from computer monitors is causing a clear decline in life expectancy.
B) Persons who live longer buy more computers over the course of their longer lifetimes.
C) Although the association is strong,computer ownership probably does not promote longevity.Instead,national per capita wealth is probably a lurking variable that drives both life expectancy and computer ownership.
D) Computer ownership promotes health and long life,probably due to the greater access that computer owners have to health information on the world-wide web.
E) Clearly,there must be some as-yet unknown health benefit associated with using computers.
Correct Answer:

Verified
Correct Answer:
Verified
Q18: Which of the following scatterplots of residuals
Q19: The figure below shows the association between
Q20: The scatterplot below displays the total home
Q21: Which of the labeled points below are
Q22: The figure below shows the association between
Q24: The table below displays the latitude
Q25: Which of the following scatterplots of residuals
Q26: Which of the labeled points below will
Q27: A university studied students' grades and established
Q28: Which of the labeled points below are