Multiple Choice
Describe what these boxplots tell you about the relationship between the provinces and salary,based on the same occupation. 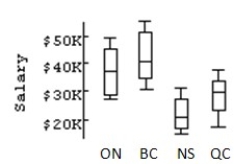
A) ON and BC have very comparable salaries.The average salaries for these provinces are just above $40K,and their spreads are very close.NS is very comparable to ON and BC.The upper 50% of salaries for NS corresponds to the lower 50% of QC salaries.
B) ON and BC have very comparable salaries.The average salaries for these provinces are just below $40K,but their spreads are different.NS is not very comparable to either ON and BC.The upper 50% of salaries for NS corresponds to the lower 50% of QC salaries.
C) ON and BC don't have very comparable salaries.The average salaries for these provinces are just below $40K,and their spreads are different.NS is not very comparable to either ON and BC.The upper 50% of salaries for QC corresponds to the lower 50% of NS salaries.
D) ON and BC have very comparable salaries.The average salaries for these provinces are just below $40K,and their spreads are very close.NS's average is the highest.The upper 50% of salaries for NS corresponds to the lower 50% of QC salaries.
E) ON and BC have very comparable salaries.The average salaries for these provinces are just below $40K,and their spreads are very close.NS is not very comparable to either ON or BC.The upper 50% of salaries for NS corresponds to the lower 50% of QC salaries.
Correct Answer:

Verified
Correct Answer:
Verified
Q7: A business owner recorded her annual
Q8: The histograms display the body fat percentages
Q9: The reaction time of 20 drivers
Q10: Here are the heights,in centimetres,of 32 Grade
Q11: Which class had the smallest standard deviation?<br>A)Class
Q13: The times,in minutes,it took for 21 students
Q14: Here are 3 boxplots of weekly gas
Q15: The boxplots display case prices (in dollars)of
Q16: The ages of the 21 members of
Q17: Which class had the largest standard deviation?<br>A)Class