Multiple Choice
A business owner recorded her annual profits for the first 12 years since opening her business in 1993.The stem-and-leaf display below shows the annual profits in thousands of dollars.Use both the stemplot and timeplot to describe the distribution. Annual Profit Totals 8
7
6
5
4
3
2
1 Key:
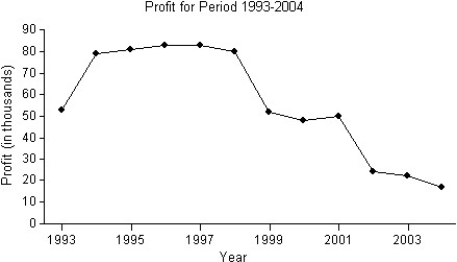
A) The distribution of the business owner's profits is skewed to the left,and is unimodal,with gaps in between.The centre is at around $50,000.The timeplot shows that the profits grew from 1993 to 1994,and were relatively steady from 1994 to 1998.After 1998,the profits declined significantly compared with those between 1993 and 1998.
B) The distribution of the business owner's profits is skewed to the left,and is multimodal,with gaps in between.One mode is at around $80,000,another at around $50,000,and a third mode at around $20,000.The timeplot shows that the profits grew from 1993 to 1994,and were relatively steady from 1994 to 2001.After 2001,the profits declined significantly compared with those between 1994 and 2001.
C) The distribution of the business owner's profits is skewed to the right,and is multimodal,with gaps in between.One mode is at around $80,000,another at around $50,000,and a third mode at around $20,000.The timeplot shows that the profits grew from 1993 to 1994,and were relatively steady from 1994 to 1998.After 1998,the profits declined significantly compared with those between 1993 and 1998.
D) The distribution of the business owner's profits is skewed to the left,and is multimodal,with gaps in between.One mode is at around $80,000,another at around $50,000,and a third mode at around $20,000.The timeplot shows that the profits grew from 1993 to 1994,and were relatively steady from 1994 to 1998.After 1998,the profits declined significantly compared with those between 1993 and 1998.
E) The distribution of the business owner's profits is skewed to the left,and is unimodal,with gaps in between.The centre is at around $50,000.The timeplot shows that the profits grew from 1993 to 1994,and were relatively steady from 1994 to 2001.After 2001,the profits declined significantly compared with those between 1994 and 2001.
Correct Answer:

Verified
Correct Answer:
Verified
Q2: Here are boxplots of the points scored
Q3: The following stem-and-leaf display shows the
Q4: Which class do you think performed better
Q5: Use the high closing values of
Q6: Use the high closing values of
Q8: The histograms display the body fat percentages
Q9: The reaction time of 20 drivers
Q10: Here are the heights,in centimetres,of 32 Grade
Q11: Which class had the smallest standard deviation?<br>A)Class
Q12: Describe what these boxplots tell you about