Multiple Choice
A university instructor created a website for her Chemistry course.The students in her class were encouraged to use the website as an additional resource for the course.At the end of the semester,the instructor asked each student how many times he or she visited the website and recorded the counts.Based on the histogram below,describe the distribution of website use. 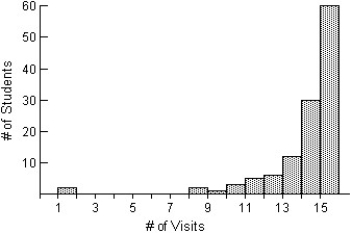
A) The distribution of the number of visits to the course website by each student for the semester is skewed to the left,with the number of visits ranging from 1 to 15 visits.The distribution is centred at about 14 visits,with many students visiting 15 times.
B) The distribution of the number of visits to the course website by each student for the semester is skewed to the left,with the number of visits ranging from 1 to 16 visits.The distribution is centred at about 14 visits,with many students visiting 15 times.There is an outlier in the distribution,two students who visited the site only once.The next highest number of visits was 8.
C) The distribution of the number of visits to the course website by each student for the semester is skewed to the right,with the number of visits ranging from 1 to 15 visits.The distribution is centred at about 14 visits,with many students visiting 15 times.There is an outlier in the distribution,two students who visited the site only once.The next highest number of visits was 8.
D) The distribution of the number of visits to the course website by each student for the semester is skewed to the left,with the number of visits ranging from 1 to 15 visits.The distribution is centred at about 14 visits,with many students visiting 15 times.There is an outlier in the distribution,two students who visited the site only once.The next highest number of visits was 8.
E) The distribution of the number of visits to the course website by each student for the semester is skewed to the left,with the number of visits ranging from 1 to 15 visits.The distribution is centred at about 12 visits,with many students visiting 15 times.There is an outlier in the distribution,two students who visited the site only once.The next highest number of visits was 8.
Correct Answer:

Verified
Correct Answer:
Verified
Q98: The data below represent the midterm grades
Q99: Here are some summary statistics for
Q100: The display shows the heights of Grade
Q101: The frequency table shows the weight,in
Q102: The weekly salaries (in dollars)of sixteen
Q104: Here are the number of baseball games
Q105: Office workers were asked how long
Q106: Ages of high school students.<br>A)The distribution would
Q107: Here is the boxplot and an ogive
Q108: The free throw percentages for participants in