Multiple Choice
Here is the boxplot and an ogive of the distribution of students marks on their statistics test. 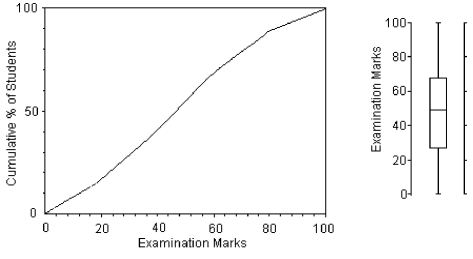 Write a few sentences describing this distribution.
A) The distribution of the marks is slightly skewed to the left.The median mark was about 48,with a max of 100 and a min of 0.The middle 50% of the marks appeared to range from 18 to 75,for an IQR of 57.55% of the students had a mark less than 50.
B) The distribution of the marks is slightly skewed to the left.The median mark was about 48,with a max of 100 and a min of 0.The middle 50% of the marks appeared to range from 26 to 66,for an IQR of 40.About 55% of the students had a mark less than 50.
C) The distribution of the marks is slightly skewed to the right.The median mark was about 48,with a max of 100 and a min of 0.The middle 50% of the marks appeared to range from 26 to 66,for an IQR of 40.About 55% of the students had a mark greater than 50.
D) The distribution of the marks is slightly skewed to the left.The median mark was about 48,with a max of 100 and a min of 0.The middle 50% of the marks appeared to range from 26 to 66,for an IQR of 40.About 55% of the students had a mark greater than 50.
E) The distribution of the marks is slightly skewed to the right.The median mark was about 55,with a max of 100 and a min of 0.The middle 50% of the marks appeared to range from 26 to 66,for an IQR of 40.About 55% of the students had a mark less than 50.
Correct Answer:

Verified
Correct Answer:
Verified
Q102: The weekly salaries (in dollars)of sixteen
Q103: A university instructor created a website for
Q104: Here are the number of baseball games
Q105: Office workers were asked how long
Q106: Ages of high school students.<br>A)The distribution would
Q108: The free throw percentages for participants in
Q109: Ages of patients who had their tonsils
Q110: Heights of adult women attending a concert.<br>A)The
Q111: The weekly salaries,in dollars,of 16 government workers
Q112: Here are the summary statistics for