Multiple Choice
A dotplot of the number of tornadoes each year in a certain county from 1948 to 2004 is given.Each dot represents a year in which there were that many tornadoes. 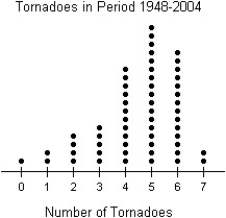
A) The distribution of the number of tornadoes per year is unimodal and symmetric,with a centre around 5 tornadoes per year.The number of tornadoes per year ranges from 0 to 7.
B) The distribution of the number of tornadoes per year is unimodal and skewed to the left,with a centre around 3.5 tornadoes per year.The number of tornadoes per year ranges from 0 to 7.
C) The distribution of the number of tornadoes per year is unimodal and symmetric,with a centre around 3.5 tornadoes per year.The number of tornadoes per year ranges from 0 to 7.
D) The distribution of the number of tornadoes per year is unimodal and skewed to the left,with a centre around 5 tornadoes per year.The number of tornadoes per year ranges from 0 to 7.
E) The distribution of the number of tornadoes per year is unimodal and skewed to the right,with a centre around 5 tornadoes per year.The number of tornadoes per year ranges from 0 to 7.
Correct Answer:

Verified
Correct Answer:
Verified
Q108: The free throw percentages for participants in
Q109: Ages of patients who had their tonsils
Q110: Heights of adult women attending a concert.<br>A)The
Q111: The weekly salaries,in dollars,of 16 government workers
Q112: Here are the summary statistics for
Q114: The test scores of 15 students are
Q115: The histogram displays the body fat percentages
Q116: The histograms display the body fat percentages
Q117: Here are summary statistics of the
Q118: Here are some summary statistics for