Multiple Choice
Here are the summary statistics for mathematics scores for one high-school graduating class. Choose the boxplot that represents the given data.
I 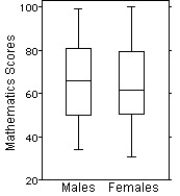
II 
III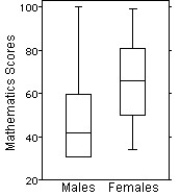
IV 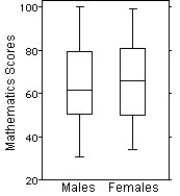
V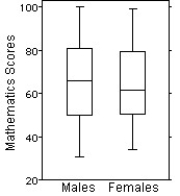
A) I
B) II
C) III
D) IV
E) V
Correct Answer:

Verified
Correct Answer:
Verified
Related Questions
Q107: Here is the boxplot and an ogive
Q108: The free throw percentages for participants in
Q109: Ages of patients who had their tonsils
Q110: Heights of adult women attending a concert.<br>A)The
Q111: The weekly salaries,in dollars,of 16 government workers
Q113: A dotplot of the number of tornadoes
Q114: The test scores of 15 students are
Q115: The histogram displays the body fat percentages
Q116: The histograms display the body fat percentages
Q117: Here are summary statistics of the