Multiple Choice
Plot the following points: (6, 2) , (7, 5) , (8, 8) , (9, 9) . In your scatter diagram, sketch a line that best seems to fit the data. Estimate the slope and the y-intercept of the line.
A) Estimated slope: 2; Estimated y-intercept: -12.5 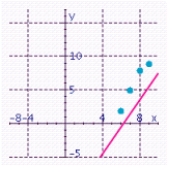
B) Estimated slope: 2.5; Estimated y-intercept: -13 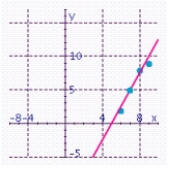
C) Estimated slope: 2.9; Estimated y-intercept: -15.3 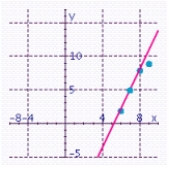
D) Estimated slope: 1.2; Estimated y-intercept: -1.5 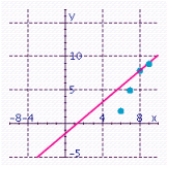
E) Estimated slope: 2.5; Estimated y-intercept: -16 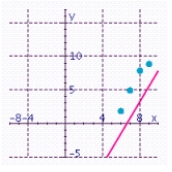
Correct Answer:

Verified
Correct Answer:
Verified
Q2: Sketch the graph of the function and
Q3: Sketch the graph of the function and
Q4: Find the linear function satisfying the
Q5: Sketch the graph of the rational
Q6: Sketch the graph of the function
Q7: A piece of wire <span
Q8: Among all rectangles having a perimeter
Q9: Suppose that the height of an object
Q10: Find all fixed points of the
Q11: Sketch the graph of the function and