Solved

Graph the Parametric Equations Using the Given Range for the Parameter

Question 25

Multiple Choice

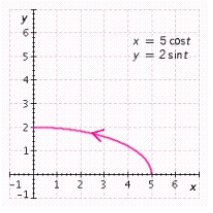
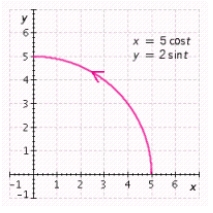
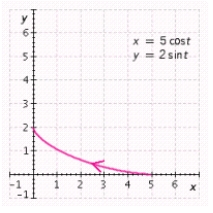
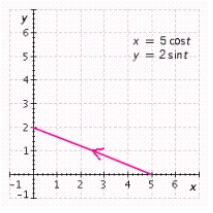
Graph the parametric equations using the given range for the parameter tt . Begin with the standard viewing rectangle and then make adjustments, as necessary, so that the graph utilizes as much of the viewing screen as possible. For example, in graphing the circle given by x=costx = \cos t and y=sinty = \sin t it would be natural to choose a viewing rectangle extending from -1 to 1 in both the xx - and yy -directions. Graph the parametric equations on a graphing utility. Sketch the result. x=5costx = 5 \cos t and y=2sinty = 2 \sin t , 0tπ20 \leq t \leq \frac { \pi } { 2 } (one-quarter of an ellipse)


A)  Graph the parametric equations using the given range for the parameter  t  . Begin with the standard viewing rectangle and then make adjustments, as necessary, so that the graph utilizes as much of the viewing screen as possible. For example, in graphing the circle given by  x = \cos t  and  y = \sin t  it would be natural to choose a viewing rectangle extending from -1 to 1 in both the  x  - and  y  -directions. Graph the parametric equations on a graphing utility. Sketch the result.  x = 5 \cos t  and  y = 2 \sin t  ,  0 \leq t \leq \frac { \pi } { 2 }  (one-quarter of an ellipse)  A)    B)    C)    D)    E)
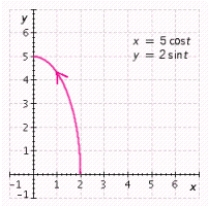
B)  Graph the parametric equations using the given range for the parameter  t  . Begin with the standard viewing rectangle and then make adjustments, as necessary, so that the graph utilizes as much of the viewing screen as possible. For example, in graphing the circle given by  x = \cos t  and  y = \sin t  it would be natural to choose a viewing rectangle extending from -1 to 1 in both the  x  - and  y  -directions. Graph the parametric equations on a graphing utility. Sketch the result.  x = 5 \cos t  and  y = 2 \sin t  ,  0 \leq t \leq \frac { \pi } { 2 }  (one-quarter of an ellipse)  A)    B)    C)    D)    E)
C)  Graph the parametric equations using the given range for the parameter  t  . Begin with the standard viewing rectangle and then make adjustments, as necessary, so that the graph utilizes as much of the viewing screen as possible. For example, in graphing the circle given by  x = \cos t  and  y = \sin t  it would be natural to choose a viewing rectangle extending from -1 to 1 in both the  x  - and  y  -directions. Graph the parametric equations on a graphing utility. Sketch the result.  x = 5 \cos t  and  y = 2 \sin t  ,  0 \leq t \leq \frac { \pi } { 2 }  (one-quarter of an ellipse)  A)    B)    C)    D)    E)
D)  Graph the parametric equations using the given range for the parameter  t  . Begin with the standard viewing rectangle and then make adjustments, as necessary, so that the graph utilizes as much of the viewing screen as possible. For example, in graphing the circle given by  x = \cos t  and  y = \sin t  it would be natural to choose a viewing rectangle extending from -1 to 1 in both the  x  - and  y  -directions. Graph the parametric equations on a graphing utility. Sketch the result.  x = 5 \cos t  and  y = 2 \sin t  ,  0 \leq t \leq \frac { \pi } { 2 }  (one-quarter of an ellipse)  A)    B)    C)    D)    E)
E)  Graph the parametric equations using the given range for the parameter  t  . Begin with the standard viewing rectangle and then make adjustments, as necessary, so that the graph utilizes as much of the viewing screen as possible. For example, in graphing the circle given by  x = \cos t  and  y = \sin t  it would be natural to choose a viewing rectangle extending from -1 to 1 in both the  x  - and  y  -directions. Graph the parametric equations on a graphing utility. Sketch the result.  x = 5 \cos t  and  y = 2 \sin t  ,  0 \leq t \leq \frac { \pi } { 2 }  (one-quarter of an ellipse)  A)    B)    C)    D)    E)

Correct Answer:

verifed

Verified

Unlock this answer now
Get Access to more Verified Answers free of charge

Related Questions