Multiple Choice
Suppose the figure shows the total cost graph for a company. Arrange the average rates of change of total cost from A to B, B to C, and A to C from smallest to greatest. 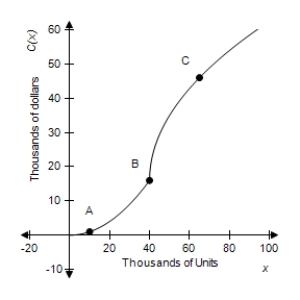
A) A to B then A to C then B to C
B) B to C then A to C then A to B
C) A to C then A to B then B to C
D) A to C then B to C then A to B
E) A to B then B to C then A to C
Correct Answer:

Verified
Correct Answer:
Verified
Q28: The graph of a company's profit function
Q29: Differentiate the given function. <img src="https://d2lvgg3v3hfg70.cloudfront.net/TB4005/.jpg"
Q30: A graph of <img src="https://d2lvgg3v3hfg70.cloudfront.net/TB4005/.jpg" alt="A graph
Q31: Given <img src="https://d2lvgg3v3hfg70.cloudfront.net/TB4005/.jpg" alt="Given ,
Q32: Use the graph of <img src="https://d2lvgg3v3hfg70.cloudfront.net/TB4005/.jpg" alt="Use
Q34: For the given function, find the slope
Q35: If the revenue for a product (in
Q36: Use properties of limits and algebraic methods
Q37: In this problem, cost, revenue, and profit
Q38: Write the equation of the tangent line