Multiple Choice
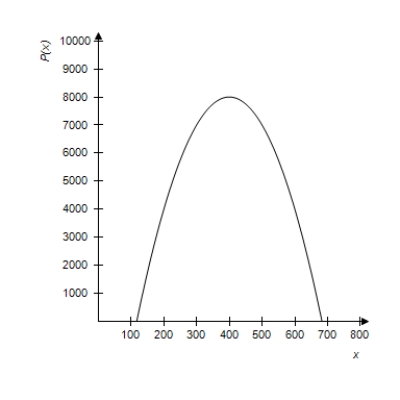
The graph of the profit function  is given as follows. Consider the average rate of change of the profit from a to 400 where a lies to the left of 400. Does the average rate of change of the profit get closer to 0 or farther from 0 as a gets closer to 400?
A) closer to 0
B) farther from 0
Correct Answer:

Verified
Correct Answer:
Verified
Q2: The profit function for a certain commodity
Q3: An equation that models the number of
Q4: Find the exact real solutions to the
Q5: The demand function for a product is
Q6: Determine whether the scatter plot should be
Q7: A fissure in the earth appeared after
Q8: The sensitivity S to a drug is
Q9: Assume that sales revenues, in millions, for
Q10: Factor the function <img src="https://d2lvgg3v3hfg70.cloudfront.net/TB4005/.jpg" alt="Factor the
Q11: Sketch the graph of the following function.