Multiple Choice
Suppose the percent of U.S. high school seniors from 1975 to 2001 who used marijuana can be modeled by 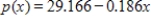 , where x is the number of years past 1975. What is the slope of the graph of this function?
A) - 0.292
B) 0.186
C) - 2.917
D) - 0.186
E) 29.166
Correct Answer:

Verified
Correct Answer:
Verified
Related Questions
Q29: According to the U.S. Bureau of the
Q30: A shipping crate has a square base
Q31: The Millcreek watershed area was heavily strip-mined
Q32: Graph the function using a window that
Q33: Solve the system by elimination, or by
Q35: Suppose that the total cost function for
Q36: Suppose a mining company will supply 80,000
Q37: Use the left-to-right elimination method to solve
Q39: Write the equation of the line through
Q150: A retired woman has $130,000 to invest.