Multiple Choice
The percent P of men 65 years of age or older in the labor force can be modeled by 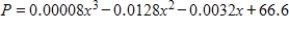 , where x is the number of years past 1890 (Source: U.S. Bureau of the Census) . Plot this function using a graphing utility. What range of x-values and y-values do you need to use to view this graph for the years 1890 to 1990?
A) x-min = 0, x-max = 100
Y-min = 0, y-max = 60
B) x-min = -100, x-max = 0
Y-min = 0, y-max = 70
C) x-min = -100 , x-max = 100
Y-min = 0, y-max = 50
D) x-min = 0, x-max = 70
Y-min = 0, y-max = 50
E) x-min = 0, x-max = 100
Y-min = 0, y-max = 70
Correct Answer:

Verified
Correct Answer:
Verified
Q178: For <img src="https://d2lvgg3v3hfg70.cloudfront.net/TB4005/.jpg" alt="For ,
Q179: Solve for y in terms of x.
Q180: The figure below is the graph of
Q181: Suppose that the cost C (in dollars)
Q182: Find the market equilibrium point for the
Q184: Suppose that a company's revenue <img src="https://d2lvgg3v3hfg70.cloudfront.net/TB4005/.jpg"
Q185: Choose the correct graph of the line
Q186: A manufacturer of DVD players has monthly
Q187: The number of millions of short tons
Q188: What is the rate of change of