True/False
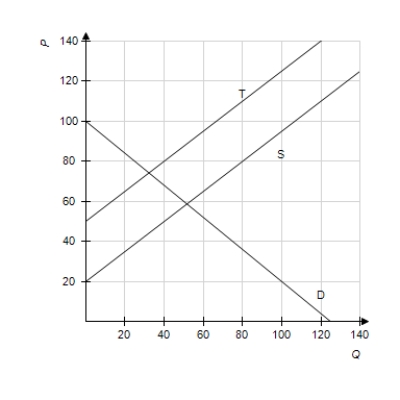
The figure below is the graph of the demand function D, the supply function S, and the supply function after a $30 tax T for the same product. Is it possible for the government to earn no money if it keeps increasing taxes on this product?
Correct Answer:

Verified
Correct Answer:
Verified
Q175: Write the equation of the line passing
Q176: The percent p of high school seniors
Q177: If <img src="https://d2lvgg3v3hfg70.cloudfront.net/TB4005/.jpg" alt="If ,
Q178: For <img src="https://d2lvgg3v3hfg70.cloudfront.net/TB4005/.jpg" alt="For ,
Q179: Solve for y in terms of x.
Q181: Suppose that the cost C (in dollars)
Q182: Find the market equilibrium point for the
Q183: The percent P of men 65 years
Q184: Suppose that a company's revenue <img src="https://d2lvgg3v3hfg70.cloudfront.net/TB4005/.jpg"
Q185: Choose the correct graph of the line