Multiple Choice
The following table shows the median age of automobiles and trucks on the road for a certain country. Use linear regression to find the linear equation that is the best fit for the data, with x equal to the number of years past 1980. 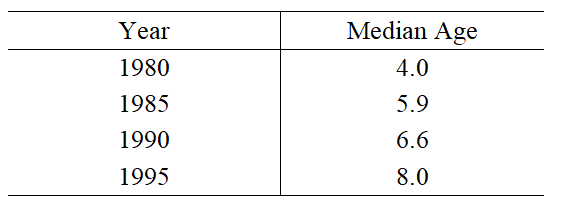
A) 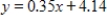
B) 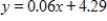
C) 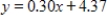
D) 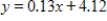
E) 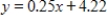
Correct Answer:

Verified
Correct Answer:
Verified
Q1: Suppose that the joint cost function for
Q2: The demand functions for q<sub>A</sub> and q<sub>B</sub>
Q4: Suppose the Cobb-Douglas production function for a
Q5: Test for relative maximum and minimum.
Q6: Suppose that the following table shows the
Q7: Suppose that the following table shows the
Q8: If <img src="https://d2lvgg3v3hfg70.cloudfront.net/TB4005/.jpg" alt="If find
Q9: Suppose wind and cold temperatures combine to
Q10: Suppose that the joint cost function for
Q11: If <img src="https://d2lvgg3v3hfg70.cloudfront.net/TB4005/.jpg" alt="If ,