Multiple Choice
Suppose that the following table shows the average hourly earnings for full-time production workers in various industries for selected years. Find the linear regression equation for hourly earnings as a function of time (with  representing 1970) . Round numerical values in your answer to four decimal places.
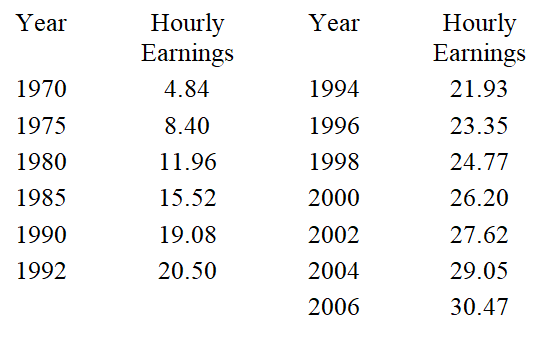
A) 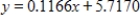 (where x is the number of years after 1970 and y is the average hourly wage)
B) 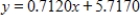 (where x is the number of years after 1970 and y is the average hourly wage)
C) 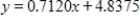 (where x is the number of years after 1970 and y is the average hourly wage)
D)  (where x is the number of years after 1970 and y is the average hourly wage)
E)  (where x is the number of years after 1970 and y is the average hourly wage)
Correct Answer:

Verified
Correct Answer:
Verified
Q1: Suppose that the joint cost function for
Q2: The demand functions for q<sub>A</sub> and q<sub>B</sub>
Q3: The following table shows the median age
Q4: Suppose the Cobb-Douglas production function for a
Q5: Test for relative maximum and minimum.
Q7: Suppose that the following table shows the
Q8: If <img src="https://d2lvgg3v3hfg70.cloudfront.net/TB4005/.jpg" alt="If find
Q9: Suppose wind and cold temperatures combine to
Q10: Suppose that the joint cost function for
Q11: If <img src="https://d2lvgg3v3hfg70.cloudfront.net/TB4005/.jpg" alt="If ,