Multiple Choice
The following table shows the rate of oil consumption (in thousands of barrels per year) by a certain city. Estimate the total consumption of oil by the city from 1999 -2004 by using 5 equal subdivisions and left-hand endpoints to estimate the area under the graph that corresponds to the table from 1999 to 2004. 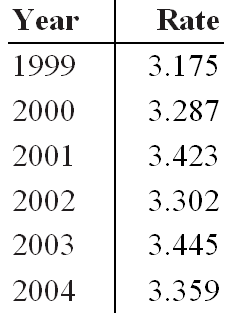
A) 17.704 thousand barrels
B) 16.632 thousand barrels
C) 16.816 thousand barrels
D) 17.546 thousand barrels
E) 15.689 thousand barrels
Correct Answer:

Verified
Correct Answer:
Verified
Q86: Use Simpson's Rule to approximate <img src="https://d2lvgg3v3hfg70.cloudfront.net/TB4005/.jpg"
Q87: Find the shaded area between the given
Q88: The graph in the following figure gives
Q89: Find the area between the curve <img
Q90: Evaluate the definite integral <img src="https://d2lvgg3v3hfg70.cloudfront.net/TB4005/.jpg" alt="Evaluate
Q92: Find the area, if it exists, of
Q93: The demand function for a product is
Q94: Find the producer's surplus for a product
Q95: The demand function for a certain product
Q96: Use integration by parts to evaluate <img