Multiple Choice
The graph in the following figure gives the times that it takes a vehicle to reach speeds from 0 mph to 25 mph, in increments of 5 mph, with a curve connecting them. Count the squares under the curve to estimate this distance. Estimate the distance traveled by the vehicle in 14 seconds, to a speed of 25 mph. (Be careful with time units.) 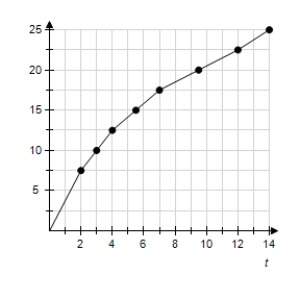
A) 1/16 mile
B) 4/15 mile
C) 1/13 mile
D) 1/9 mile
E) 1/8 mile
Correct Answer:

Verified
Correct Answer:
Verified
Q83: When the area under <img src="https://d2lvgg3v3hfg70.cloudfront.net/TB4005/.jpg" alt="When
Q84: Use the Trapezoidal Rule to approximate <img
Q85: For a certain product, the total revenue
Q86: Use Simpson's Rule to approximate <img src="https://d2lvgg3v3hfg70.cloudfront.net/TB4005/.jpg"
Q87: Find the shaded area between the given
Q89: Find the area between the curve <img
Q90: Evaluate the definite integral <img src="https://d2lvgg3v3hfg70.cloudfront.net/TB4005/.jpg" alt="Evaluate
Q91: The following table shows the rate of
Q92: Find the area, if it exists, of
Q93: The demand function for a product is