Multiple Choice
The graph in the following figure gives the times that it takes a vehicle to reach speeds from 0 mph to 25 mph, in increments of 5 mph, with a curve connecting them. Count the squares under the curve to estimate this distance. Estimate the distance traveled by the vehicle in 14 seconds, to a speed of 25 mph. (Be careful with time units.) 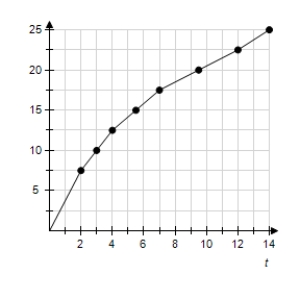
A) 1/16 mile
B) 4/15 mile
C) 1/13 mile
D) 1/9 mile
E) 1/8 mile
Correct Answer:

Verified
Correct Answer:
Verified
Q91: The following table shows the rate of
Q98: Use integration by parts to evaluate <img
Q99: The production from a particular assembly line
Q100: Find the area of the shaded region.
Q101: Evaluate the integral <img src="https://d2lvgg3v3hfg70.cloudfront.net/TB4005/.jpg" alt="Evaluate the
Q102: The total cost function for a product
Q104: Evaluate the integral <img src="https://d2lvgg3v3hfg70.cloudfront.net/TB4005/.jpg" alt="Evaluate the
Q105: Evaluate the integral <img src="https://d2lvgg3v3hfg70.cloudfront.net/TB4005/.jpg" alt="Evaluate the
Q106: Determine the most appropriate method or integral
Q107: Use the sum formulas to find the