Multiple Choice
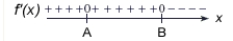
Use the sign diagram for  to determine x-values at which relative maxima occur, where
  and
and  .
. 
A) 
B) 
C)  and
and 
D) 
E) no relative maxima
Correct Answer:

Verified
Correct Answer:
Verified
Related Questions
Q135: For the cost function <img src="https://d2lvgg3v3hfg70.cloudfront.net/TB4005/.jpg" alt="For
Q136: Analytically determine any relative minima. Round your
Q137: The number of milligrams x of a
Q139: Suppose the average costs of a mining
Q141: Use the graph shown in the figure
Q142: The percent p of impurities that can
Q143: For the revenue function given by <img
Q144: A graph of <img src="https://d2lvgg3v3hfg70.cloudfront.net/TB4005/.jpg" alt="A graph
Q145: For the given function, use the graph
Q149: From a tract of land, a developer