Multiple Choice
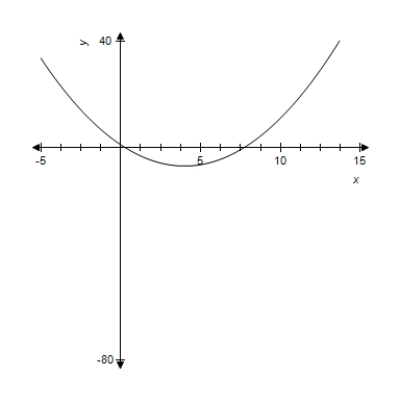
For the given function, use the graph to identify x-values for which  . You may use the derivative to check your conclusion.
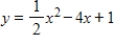
A) 
B) 
C) 
D) 
E) 
Correct Answer:

Verified
Correct Answer:
Verified
Related Questions
Q140: Use the sign diagram for <img src="https://d2lvgg3v3hfg70.cloudfront.net/TB4005/.jpg"
Q141: Use the graph shown in the figure
Q142: The percent p of impurities that can
Q143: For the revenue function given by <img
Q144: A graph of <img src="https://d2lvgg3v3hfg70.cloudfront.net/TB4005/.jpg" alt="A graph
Q146: Suppose the average costs of a mining
Q147: A graph of <img src="https://d2lvgg3v3hfg70.cloudfront.net/TB4005/.jpg" alt="A graph
Q148: Find any vertical asymptotes for the given
Q149: Sketch the graph of the function <img
Q150: A printer has a contract to print