Multiple Choice
Use the graph shown in the figure and identify points from A through I that satisfy the given condition.  and
and 
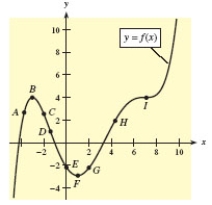
A) C
B) F
C) I
D) A
E) B
Correct Answer:

Verified
Correct Answer:
Verified
Related Questions
Q27: Find any horizontal asymptotes for the given
Q28: A function and its first and second
Q29: For the given function, classify the critical
Q30: A function and its first and second
Q31: A function and its graph are given.
Q33: The graph shows a total cost function.
Q35: The profit from a grove of orange
Q36: The percent p of impurities that can
Q37: Use the sign diagram for <img src="https://d2lvgg3v3hfg70.cloudfront.net/TB4005/.jpg"
Q128: A box with an open top and