Multiple Choice
The graph shows a total cost function. Determine the level of production at which average cost is minimized. 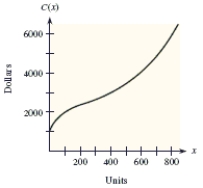
A) 400 units
B) 800 units
C) 200 units
D) 0 units
E) 600 units
Correct Answer:

Verified
Correct Answer:
Verified
Related Questions
Q28: A function and its first and second
Q29: For the given function, classify the critical
Q30: A function and its first and second
Q31: A function and its graph are given.
Q32: Use the graph shown in the figure
Q35: The profit from a grove of orange
Q36: The percent p of impurities that can
Q37: Use the sign diagram for <img src="https://d2lvgg3v3hfg70.cloudfront.net/TB4005/.jpg"
Q38: The following figure shows the growth of
Q128: A box with an open top and