Multiple Choice
The following figure shows the growth of a population as a function of time. 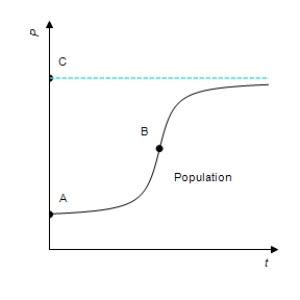 If P represents the population and t represents the time, write a mathematical symbol that represents the rate of change (growth rate) of the population with respect to time.
A) 
B) 
C) 
D) 
E) 
Correct Answer:

Verified
Correct Answer:
Verified
Q33: The graph shows a total cost function.
Q35: The profit from a grove of orange
Q36: The percent p of impurities that can
Q37: Use the sign diagram for <img src="https://d2lvgg3v3hfg70.cloudfront.net/TB4005/.jpg"
Q39: For the given function, find the critical
Q40: Find all points of inflection of the
Q41: A small business has weekly average costs
Q42: Use the graph of <img src="https://d2lvgg3v3hfg70.cloudfront.net/TB4005/.jpg" alt="Use
Q43: Use the sign diagram for <img src="https://d2lvgg3v3hfg70.cloudfront.net/TB4005/.jpg"
Q128: A box with an open top and