Multiple Choice
The figure shows the graph of the position x as a function of time for an object moving in the straight line (the x-axis) . Which of the following graphs best describes the velocity along the x-axis as a function of time for this object? 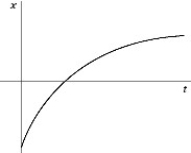
A) 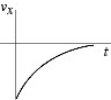
B) 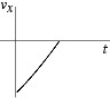
C) 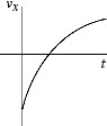
D) 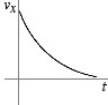
E) 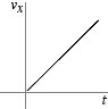
Correct Answer:

Verified
Correct Answer:
Verified
Related Questions
Q23: If the acceleration of an object is
Q27: The figure represents the position of a
Q29: A car is 200 m from a
Q30: Which one of the following graphs could
Q31: An object starts from rest at time
Q33: A ball is thrown directly upward and
Q33: The acceleration of an object as a
Q34: A rock is dropped from the top
Q35: If the fastest you can safely drive
Q37: The figure represents the velocity of a