Multiple Choice
Which one of the following graphs could possibly represent the vertical position as a function of time for an object in free fall?
A) 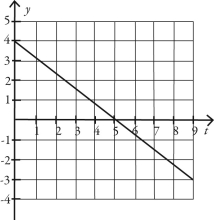
B) 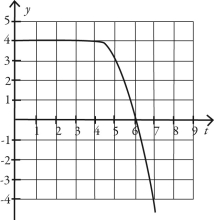
C) 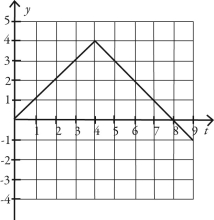
D) 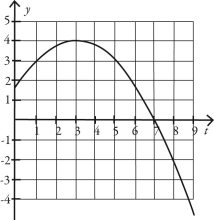
E) 
Correct Answer:

Verified
Correct Answer:
Verified
Related Questions
Q14: An object is moving with constant non-zero
Q26: The graph in the figure shows the
Q27: The figure represents the position of a
Q29: A car is 200 m from a
Q31: An object starts from rest at time
Q32: The figure shows the graph of the
Q33: A ball is thrown directly upward and
Q33: The acceleration of an object as a
Q34: A rock is dropped from the top
Q35: If the fastest you can safely drive