Multiple Choice
A graph of the force on an object as a function of its position is shown in the figure. Determine the amount of work done by this force on the object during a displacement from x = -2.00 m to x = 2.00 m. (Assume an accuracy of 3 significant figures for the numbers on the graph.) 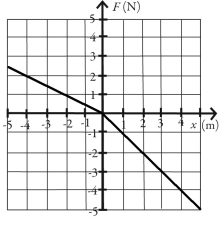
A) -12.0 J
B) -3.00 J
C) -1.00 J
D) 12.0 J
E) 3.00 J
Correct Answer:

Verified
Correct Answer:
Verified
Related Questions
Q5: A student slides her 80.0-kg desk across
Q26: A ball is thrown upward at an
Q28: How long will it take a 7.08
Q29: How much energy is needed to change
Q30: In the figure, a 700-kg crate is
Q33: A constant horizontal pull acts on a
Q34: In the figure, two identical ideal massless
Q35: Block A (0.40 kg) and block B
Q36: Find the net work done by friction
Q54: A worker lifts a 20.0-kg bucket of