Multiple Choice
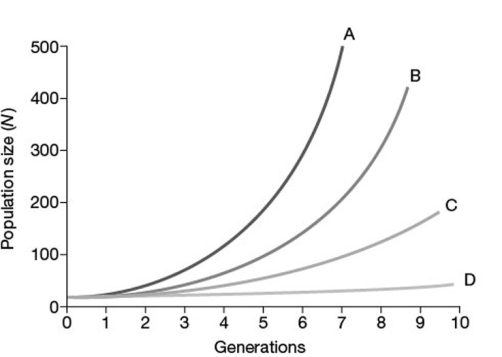
-In the accompanying figure, which of the lines represents the highest per capita rate increase (r) ?
A) line A
B) line B
C) line C
D) line D
Correct Answer:

Verified
Correct Answer:
Verified
Q34: Which of the following scenarios would provide
Q35: <img src="https://d2lvgg3v3hfg70.cloudfront.net/TB3735/.jpg" alt=" -In the accompanying
Q36: Often the growth cycle of one population
Q37: <img src="https://d2lvgg3v3hfg70.cloudfront.net/TB3735/.jpg" alt=" -Assuming that these
Q38: <img src="https://d2lvgg3v3hfg70.cloudfront.net/TB3735/.jpg" alt=" The figure shown
Q40: Why do populations grow more slowly as
Q41: You observe two female fish of the
Q42: Which of the following statements regarding the
Q43: <img src="https://d2lvgg3v3hfg70.cloudfront.net/TB3735/.jpg" alt=" Graph (b) in
Q44: Which of the following best defines a